


Census Tract 151, Jackson County, Missouri
About
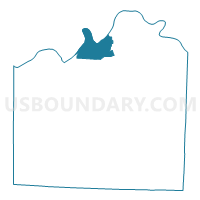
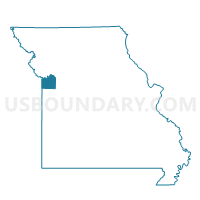
Outline

Summary
| Unique Area Identifier | 469404 |
| Name | Census Tract 151 |
| County | Jackson County |
| State | Missouri |
| Area (square miles) | 15.76 |
| Land Area (square miles) | 15.00 |
| Water Area (square miles) | 0.76 |
| % of Land Area | 95.17 |
| % of Water Area | 4.83 |
| Latitude of the Internal Point | 39.15426930 |
| Longtitude of the Internal Point | -94.37207600 |
| Total Population | 5,669 |
| Total Housing Units | 2,084 |
| Total Households | 1,966 |
| Median Age | 35.9 |
Maps

Graphs
Select a template below for downloading or customizing gragh for Census Tract 151, Jackson County, Missouri


Neighbors
Neighoring Census Tract (by Name) Neighboring Census Tract on the Map
- Census Tract 111, Jackson County, MO
- Census Tract 112, Jackson County, MO
- Census Tract 113, Jackson County, MO
- Census Tract 150, Jackson County, MO
- Census Tract 177, Jackson County, MO
- Census Tract 216, Clay County, MO
- Census Tract 222, Clay County, MO
- Census Tract 223.01, Clay County, MO
Top 10 Neighboring County Subdivision (by Population) Neighboring County Subdivision on the Map
- Blue township, Jackson County, MO (160,322)
- Liberty township, Clay County, MO (56,978)
- Chouteau township, Clay County, MO (50,819)
- Fishing River township, Clay County, MO (11,042)
Top 10 Neighboring Place (by Population) Neighboring Place on the Map
- Kansas City city, MO (459,787)
- Independence city, MO (116,830)
- Liberty city, MO (29,149)
- Sugar Creek city, MO (3,345)
- River Bend village, MO (10)
Top 10 Neighboring Unified School District (by Population) Neighboring Unified School District on the Map
- North Kansas City School District, MO (123,348)
- Independence Public Schools, MO (94,720)
- Liberty Schools, MO (53,223)
- Fort Osage R-I School District, MO (25,145)
Top 10 Neighboring State Legislative District Lower Chamber (by Population) Neighboring State Legislative District Lower Chamber on the Map
- State House District 35, MO (58,725)
- State House District 53, MO (37,852)
- State House District 34, MO (37,756)
- State House District 51, MO (32,299)
Top 10 Neighboring State Legislative District Upper Chamber (by Population) Neighboring State Legislative District Upper Chamber on the Map
- State Senate District 8, MO (205,505)
- State Senate District 17, MO (199,316)
- State Senate District 11, MO (166,163)
Top 10 Neighboring 111th Congressional District (by Population) Neighboring 111th Congressional District on the Map
Top 10 Neighboring 5-Digit ZIP Code Tabulation Area (by Population) Neighboring 5-Digit ZIP Code Tabulation Area on the Map
Explore Neighbors on the MapData
Demographic, Population, Households, and Housing Units
** Data sources from census 2010 **
Show Data on Map
Download Full List as CSV
Download Quick Sheet as CSV
| Subject | This Area | Jackson County | Missouri | National |
|---|---|---|---|---|
| POPULATION | ||||
| Total Population Map | 5,669 | 674,158 | 5,988,927 | 308,745,538 |
| POPULATION, HISPANIC OR LATINO ORIGIN | ||||
| Not Hispanic or Latino Map | 5,390 | 617,724 | 5,776,457 | 258,267,944 |
| Hispanic or Latino Map | 279 | 56,434 | 212,470 | 50,477,594 |
| POPULATION, RACE | ||||
| White alone Map | 5,115 | 451,073 | 4,958,770 | 223,553,265 |
| Black or African American alone Map | 132 | 161,367 | 693,391 | 38,929,319 |
| American Indian and Alaska Native alone Map | 29 | 3,352 | 27,376 | 2,932,248 |
| Asian alone Map | 34 | 10,755 | 98,083 | 14,674,252 |
| Native Hawaiian and Other Pacific Islander alone Map | 97 | 1,610 | 6,261 | 540,013 |
| Some Other Race alone Map | 80 | 25,315 | 80,457 | 19,107,368 |
| Two or More Races Map | 182 | 20,686 | 124,589 | 9,009,073 |
| POPULATION, SEX | ||||
| Male Map | 2,854 | 325,853 | 2,933,477 | 151,781,326 |
| Female Map | 2,815 | 348,305 | 3,055,450 | 156,964,212 |
| POPULATION, AGE (18 YEARS) | ||||
| 18 years and over Map | 4,140 | 508,523 | 4,563,491 | 234,564,071 |
| Under 18 years | 1,529 | 165,635 | 1,425,436 | 74,181,467 |
| POPULATION, AGE | ||||
| Under 5 years | 401 | 47,883 | 390,237 | 20,201,362 |
| 5 to 9 years | 409 | 45,868 | 390,463 | 20,348,657 |
| 10 to 14 years | 468 | 44,721 | 396,925 | 20,677,194 |
| 15 to 17 years | 251 | 27,163 | 247,811 | 12,954,254 |
| 18 and 19 years | 155 | 17,585 | 175,975 | 9,086,089 |
| 20 years | 71 | 8,469 | 86,528 | 4,519,129 |
| 21 years | 69 | 8,308 | 83,511 | 4,354,294 |
| 22 to 24 years | 198 | 28,851 | 243,250 | 12,712,576 |
| 25 to 29 years | 378 | 52,241 | 403,239 | 21,101,849 |
| 30 to 34 years | 372 | 45,972 | 372,228 | 19,962,099 |
| 35 to 39 years | 364 | 43,720 | 368,070 | 20,179,642 |
| 40 to 44 years | 373 | 42,997 | 380,546 | 20,890,964 |
| 45 to 49 years | 406 | 49,524 | 444,766 | 22,708,591 |
| 50 to 54 years | 434 | 49,320 | 443,806 | 22,298,125 |
| 55 to 59 years | 377 | 42,738 | 389,985 | 19,664,805 |
| 60 and 61 years | 148 | 14,994 | 140,830 | 7,113,727 |
| 62 to 64 years | 214 | 19,814 | 192,463 | 9,704,197 |
| 65 and 66 years | 97 | 10,777 | 108,394 | 5,319,902 |
| 67 to 69 years | 122 | 14,514 | 148,659 | 7,115,361 |
| 70 to 74 years | 133 | 18,476 | 193,437 | 9,278,166 |
| 75 to 79 years | 92 | 15,868 | 155,271 | 7,317,795 |
| 80 to 84 years | 70 | 12,477 | 118,754 | 5,743,327 |
| 85 years and over | 67 | 11,878 | 113,779 | 5,493,433 |
| MEDIAN AGE BY SEX | ||||
| Both sexes Map | 35.90 | 36.20 | 37.90 | 37.20 |
| Male Map | 33.80 | 34.90 | 36.50 | 35.80 |
| Female Map | 37.80 | 37.40 | 39.20 | 38.50 |
| HOUSEHOLDS | ||||
| Total Households Map | 1,966 | 274,804 | 2,375,611 | 116,716,292 |
| HOUSEHOLDS, HOUSEHOLD TYPE | ||||
| Family households: Map | 1,560 | 167,088 | 1,552,133 | 77,538,296 |
| Husband-wife family Map | 1,167 | 110,090 | 1,150,929 | 56,510,377 |
| Other family: Map | 393 | 56,998 | 401,204 | 21,027,919 |
| Male householder, no wife present Map | 120 | 13,868 | 109,000 | 5,777,570 |
| Female householder, no husband present Map | 273 | 43,130 | 292,204 | 15,250,349 |
| Nonfamily households: Map | 406 | 107,716 | 823,478 | 39,177,996 |
| Householder living alone Map | 320 | 87,452 | 672,276 | 31,204,909 |
| Householder not living alone Map | 86 | 20,264 | 151,202 | 7,973,087 |
| HOUSEHOLDS, HISPANIC OR LATINO ORIGIN OF HOUSEHOLDER | ||||
| Not Hispanic or Latino householder: Map | 1,906 | 259,256 | 2,319,445 | 103,254,926 |
| Hispanic or Latino householder: Map | 60 | 15,548 | 56,166 | 13,461,366 |
| HOUSEHOLDS, RACE OF HOUSEHOLDER | ||||
| Householder who is White alone | 1,838 | 193,465 | 2,020,416 | 89,754,352 |
| Householder who is Black or African American alone | 43 | 63,975 | 259,539 | 14,129,983 |
| Householder who is American Indian and Alaska Native alone | 11 | 1,308 | 10,427 | 939,707 |
| Householder who is Asian alone | 8 | 3,623 | 31,808 | 4,632,164 |
| Householder who is Native Hawaiian and Other Pacific Islander alone | 20 | 453 | 1,605 | 143,932 |
| Householder who is Some Other Race alone | 13 | 6,768 | 20,727 | 4,916,427 |
| Householder who is Two or More Races | 33 | 5,212 | 31,089 | 2,199,727 |
| HOUSEHOLDS, HOUSEHOLD TYPE BY HOUSEHOLD SIZE | ||||
| Family households: Map | 1,560 | 167,088 | 1,552,133 | 77,538,296 |
| 2-person household Map | 627 | 71,417 | 699,051 | 31,882,616 |
| 3-person household Map | 355 | 39,370 | 352,533 | 17,765,829 |
| 4-person household Map | 309 | 30,790 | 289,496 | 15,214,075 |
| 5-person household Map | 157 | 15,220 | 133,129 | 7,411,997 |
| 6-person household Map | 71 | 6,187 | 49,302 | 3,026,278 |
| 7-or-more-person household Map | 41 | 4,104 | 28,622 | 2,237,501 |
| Nonfamily households: Map | 406 | 107,716 | 823,478 | 39,177,996 |
| 1-person household Map | 320 | 87,452 | 672,276 | 31,204,909 |
| 2-person household Map | 63 | 16,729 | 123,465 | 6,360,012 |
| 3-person household Map | 16 | 2,283 | 17,929 | 992,156 |
| 4-person household Map | 4 | 814 | 7,052 | 411,171 |
| 5-person household Map | 1 | 291 | 1,848 | 126,634 |
| 6-person household Map | 2 | 89 | 559 | 48,421 |
| 7-or-more-person household Map | 0 | 58 | 349 | 34,693 |
| HOUSING UNITS | ||||
| Total Housing Units Map | 2,084 | 312,105 | 2,712,729 | 131,704,730 |
| HOUSING UNITS, OCCUPANCY STATUS | ||||
| Occupied Map | 1,966 | 274,804 | 2,375,611 | 116,716,292 |
| Vacant Map | 118 | 37,301 | 337,118 | 14,988,438 |
| HOUSING UNITS, OCCUPIED, TENURE | ||||
| Owned with a mortgage or a loan Map | 1,222 | 124,016 | 1,118,792 | 52,979,430 |
| Owned free and clear Map | 374 | 44,781 | 514,818 | 23,006,644 |
| Renter occupied Map | 370 | 106,007 | 742,001 | 40,730,218 |
| HOUSING UNITS, VACANT, VACANCY STATUS | ||||
| For rent Map | 44 | 16,211 | 92,946 | 4,137,567 |
| Rented, not occupied Map | 1 | 521 | 4,290 | 206,825 |
| For sale only Map | 43 | 5,677 | 44,200 | 1,896,796 |
| Sold, not occupied Map | 4 | 1,079 | 11,098 | 421,032 |
| For seasonal, recreational, or occasional use Map | 2 | 1,465 | 80,374 | 4,649,298 |
| For migrant workers Map | 0 | 14 | 193 | 24,161 |
| Other vacant Map | 24 | 12,334 | 104,017 | 3,652,759 |
| HOUSING UNITS, OCCUPIED, AVERAGE HOUSEHOLD SIZE BY TENURE | ||||
| Total: Map | 2.86 | 2.41 | 2.45 | 2.58 |
| Owner occupied Map | 2.78 | 2.52 | 2.54 | 2.65 |
| Renter occupied Map | 3.16 | 2.24 | 2.25 | 2.44 |
| HOUSING UNITS, OCCUPIED, TENURE BY RACE OF HOUSEHOLDER | ||||
| Owner occupied: Map | 1,596 | 168,797 | 1,633,610 | 75,986,074 |
| Householder who is White alone Map | 1,510 | 133,952 | 1,474,738 | 63,446,275 |
| Householder who is Black or African American alone Map | 26 | 26,706 | 110,128 | 6,261,464 |
| Householder who is American Indian and Alaska Native alone Map | 5 | 640 | 6,019 | 509,588 |
| Householder who is Asian alone Map | 7 | 1,972 | 17,427 | 2,688,861 |
| Householder who is Native Hawaiian and Other Pacific Islander alone Map | 14 | 202 | 600 | 61,911 |
| Householder who is Some Other Race alone Map | 10 | 3,010 | 8,794 | 1,975,817 |
| Householder who is Two or More Races Map | 24 | 2,315 | 15,904 | 1,042,158 |
| Renter occupied: Map | 370 | 106,007 | 742,001 | 40,730,218 |
| Householder who is White alone Map | 328 | 59,513 | 545,678 | 26,308,077 |
| Householder who is Black or African American alone Map | 17 | 37,269 | 149,411 | 7,868,519 |
| Householder who is American Indian and Alaska Native alone Map | 6 | 668 | 4,408 | 430,119 |
| Householder who is Asian alone Map | 1 | 1,651 | 14,381 | 1,943,303 |
| Householder who is Native Hawaiian and Other Pacific Islander alone Map | 6 | 251 | 1,005 | 82,021 |
| Householder who is Some Other Race alone Map | 3 | 3,758 | 11,933 | 2,940,610 |
| Householder who is Two or More Races Map | 9 | 2,897 | 15,185 | 1,157,569 |
| HOUSING UNITS, OCCUPIED, TENURE BY HISPANIC OR LATINO ORIGIN OF HOUSEHOLDER | ||||
| Owner occupied: Map | 1,596 | 168,797 | 1,633,610 | 75,986,074 |
| Not Hispanic or Latino householder Map | 1,552 | 161,119 | 1,605,838 | 69,617,625 |
| Hispanic or Latino householder Map | 44 | 7,678 | 27,772 | 6,368,449 |
| Renter occupied: Map | 370 | 106,007 | 742,001 | 40,730,218 |
| Not Hispanic or Latino householder Map | 354 | 98,137 | 713,607 | 33,637,301 |
| Hispanic or Latino householder Map | 16 | 7,870 | 28,394 | 7,092,917 |
| HOUSING UNITS, OCCUPIED, TENURE BY HOUSEHOLD SIZE | ||||
| Owner occupied: Map | 1,596 | 168,797 | 1,633,610 | 75,986,074 |
| 1-person household Map | 258 | 42,165 | 369,640 | 16,453,569 |
| 2-person household Map | 608 | 61,676 | 629,004 | 27,618,605 |
| 3-person household Map | 285 | 26,979 | 262,364 | 12,517,563 |
| 4-person household Map | 245 | 21,626 | 221,292 | 10,998,793 |
| 5-person household Map | 119 | 10,051 | 97,390 | 5,057,765 |
| 6-person household Map | 50 | 3,839 | 34,420 | 1,965,796 |
| 7-or-more-person household Map | 31 | 2,461 | 19,500 | 1,373,983 |
| Renter occupied: Map | 370 | 106,007 | 742,001 | 40,730,218 |
| 1-person household Map | 62 | 45,287 | 302,636 | 14,751,340 |
| 2-person household Map | 82 | 26,470 | 193,512 | 10,624,023 |
| 3-person household Map | 86 | 14,674 | 108,098 | 6,240,422 |
| 4-person household Map | 68 | 9,978 | 75,256 | 4,626,453 |
| 5-person household Map | 39 | 5,460 | 37,587 | 2,480,866 |
| 6-person household Map | 23 | 2,437 | 15,441 | 1,108,903 |
| 7-or-more-person household Map | 10 | 1,701 | 9,471 | 898,211 |
Loading...